![]()
![]()
![]()
![]()
![]()
![]()
![]()
![]()


Research - Rehabilitation - Re-Employment
Project # AREF Williams #0001
Michael Williams, M.S., Principal Investigator
William De l’Aune, Ph.D., Investigator
Bruce Blasch, Ph.D., Investigator
Gale Watson, M.Ed., Investigator
Rehabilitation R&D Center (151R)
VA Medical Center
1670 Clairmont Road
Decatur, GA 30033
Ph: 404 321-6111, x7981
This project was funded by the Blinded American Veterans Foundation
STATEMENT OF THE PROBLEM
This six-month project gathered needs data from 3,621 visually impaired veterans using a short, large print, mailed questionnaire. The purposes of this descriptive, exploratory project were to establish general demographic characteristics and gain an understanding of the perceived needs of that population. While considerable data are available on veterans attending VA blind rehabilitation programs, little is known about visually impaired veterans who do not enter these programs. This information is crucial in the design and/or optimization of the delivery of clinical services and assistive technology to this veteran population. This study directly addresses the mission of the Department of Veterans Affairs by attending to "compensation for loss" issues and "quality of life" mandates. There are presently over 93,000 legally blind veterans. By the year 2010, it is estimated this number will be over 147,000, and 880,000 will have severe visual impairments (Goodrich, 1995). As the veteran population ages, these figures will continue to rise dramatically. Current theoretical capacity of Blind Rehabilitation for residential rehabilitation programs is 1,400 veterans per year (Garner, 1995). This results in unacceptable waiting times and decreased ability to serve the veterans. Research funded in this area will contribute to greater efficiency and effectiveness of service delivery as mandated in Prescription for Change (Kizer, 1996). The results from this needs assessment survey are anticipated to increase and augment existing demographic and diagnostic profile data on this particular population of visually impaired veterans.
CURRENT STATUS OF VA RESEARCH IN BLIND REHABILITATION OUTCOMES
The lack of valid and reliable information about outcomes of rehabilitation programs serving visually impaired persons causes a significant limitation in documentation and improvement of service delivery to veterans who are blind and visually impaired. As in other health care delivery systems, such outcome data can be used to investigate important questions such as the relative cost-benefit of various models of vision rehabilitation services, the relationship of functional outcomes to psychosocial outcomes, and the usefulness of outcomes data in programmatic decision making. The absence of valid, reliable, and responsive outcome measurement tools for blind rehabilitation makes such investigations difficult or impossible.
In response to increasing demands for information about veterans undergoing VA sponsored blind rehabilitation, the Atlanta Rehab R&D Center with Dr. William De l’Aune serving as Acting Director, hosted a meeting of the Blind Rehabilitation Service Task Force on Outcome Measures (BRSTGO) in the Spring of 1996. This meeting and subsequent weekly conference calls resulted in the creation of the Blind Rehabilitation Service Follow-up Outcomes Survey, referred to as BRSFOutSur (see Appendix E). The BRSFOutSur is now being used by the VA Blind Rehabilitation Service (BRS) as well as by the National Accreditation Council for Agencies Serving the Blind and Visually Handicapped (NAC). The Atlanta VA Rehab R&D Center is currently coordinating the data gathering and analysis of the resulting outcomes data for both the BRS and NAC groups in the currently funded project, C2179R, "Outcome Assessment of the Rehabilitation of the Visually Impaired," and C2241R, "Outcomes of the Outpatient Rehabilitation of the Visually Impaired."
BRSDBase - Blind Rehabilitation Service Data Base
The project team has developed and is currently collecting extensive information about the blinded veteran demographic, rehabilitation, and medical history contained in the Blind Rehabilitation Service DataBase (BRSDBase). This instrument includes many factors that can be used for risk adjustment in outcomes studies resulting from this project. This data set is serving as the model for the Blinded Veteran Registry currently being developed by VA Headquarters (VAHQ) in cooperation with the BRSTGO.
BRSSatSur - Blind Rehabilitation Service Satisfaction Survey
The research team also developed the Blind Rehabilitation Service Satisfaction Survey (BRSSatSur). The information derived from this instrument is currently being used at both Veterans Integrated Service Network (VISN), and VAHQ to evaluate management performance. It should be noted that question 15 ("How would you rate your overall satisfaction with the blind rehabilitation program?") has been chosen by VAHQ as the overall index of Blind Rehabilitation Satisfaction. Results to date indicate that 1354 of 1380 veterans surveyed (98%) express either "satisfaction" or "complete satisfaction" in response to this question.
BRSFOutSur - Blind Rehabilitation Service Follow-up Outcome Survey
The central measure used in this project was the BRSFOutSur, developed by the Blind Rehabilitation Service Task Group on Outcomes in 1996. The BRSFOutSur samples behaviors associated with each of the four major Blind Rehabilitation skill area domains (Orientation and Mobility, Communication and Activities of Daily Living, Manual Skills, and Visual Skills) as well as other behaviors associated with general adjustment to blindness.
Due to these ongoing efforts, considerable information is now available on 2,472 visually impaired veterans who have attended VA residential blind rehabilitation programs during the last eighteen months, however, very little information is available on veterans who are unable or chose not to avail themselves of these services. It is therefore crucial that further research geared at capturing demographic, diagnostic and needs data from those blind and visually impaired veterans not currently being tracked through the various Department of Veterans Affairs blindness and vision service mechanisms be developed. This project: "Needs Assessment of Visually Impaired Veterans" achieves the first real effort that has been developed to track data from those blind and visually impaired veterans that may currently be outside of the VA Blind Rehabilitation Service.
RESEARCH METHODS
SampleThe population that was surveyed was taken from a list of approximately 14,100 veterans currently on the compensation and pension roles of the Department of Veterans Affairs for blindness. This list was made available to the Blinded American Veterans Foundation (BAVF) by the Department of Veterans Affairs and was provided to project investigators for the purposes of this study. It was anticipated by project investigators that this sample population of visually impaired veterans would share similar demographic and diagnostic characteristics as compared to existing data on veterans that have participated in VA blind rehabilitation programs currently being examined under the auspices of C2179R, "Outcome Assessment of the Rehabilitation of the Visually Impaired," and C2241R, "Outcomes of the Outpatient Rehabilitation of the Visually Impaired."
Survey Instrument and Protocol
It was determined by investigators that a self-reported needs assessment survey delivered and returned through the mail would be the most effective and practical approach to collecting information from this large of a group of potential respondents. The mailing included a cover sheet which: 1) invited the veteran to participate in the survey; 2) explained the purposes of the project; 3) informed the veteran of his right to refuse to participate; 4) assured him/her that confidentiality would be maintained for all responses; and, 5) reinforced that his/her answers would have no impact on services provided. Enclosed along with the cover letter was the actual survey instrument as well as a postage paid return envelope. A copy of this cover sheet is attached as Appendix A.
The survey itself was very brief. The content of the survey questions was determined through consultation between the project investigators and the Board of Directors of the BAVF during the first month of the project. The entire survey was designed to fit on one side of a pre-folded, self-mailing sheet. Initially the survey was developed to facilitate scanned input technology. It was later determined that due to the limited budget of the project scanning the completed surveys was not feasible. The survey obtained basic demographic information such as age, date of last rehabilitation service, point of delivery for any prior rehabilitation (VA or other), receipt of prosthetic devices from the VA, and living arrangement status. The instrument also obtained information about specific rehabilitation needs, (as perceived by the respondent), in checklist form. Furthermore, the survey examined current level of utilization of computer technology by the respondents, as well as the level of interest in learning to use computer technology.
The final version of the "Needs Assessment of Visually Impaired Veterans" survey instrument consisted of 12 items. It is estimated that the entire survey took less than five minutes to complete. One of the options included at the beginning of the survey was not participate in the study, which simply required checking one box and returning the response form. The survey instrument sheets were printed with a randomly generated identity code for each survey recipient in order to facilitate accuracy in determining respondents from non-respondents, while assuring confidentiality. A copy of this survey instrument is attached as Appendix B. Approval for administration of this research project was sought and granted from Emory University’s Human Investigations Committee (HIC), and was assigned HIC Protocol No: 311-98. A copy of this HIC approval letter is attached as Appendix C.
A modified research design based on The Dillman TDM Total Design Method (1978) for mail surveys was employed to administer the survey instrument. The survey instrument was pre-tested with a small sample of subjects (n=300) in order to determine the efficacy and responsiveness of the survey instrument. It was determined that the survey instrument had been designed in such a way that minimized difficulty for the visually impaired respondents in completing the survey. Investigators felt that the design of the survey instrument was critical to the success of the project and spent a significant amount of time and effort developing and refining the final version of the instrument. Approximately 14 days after the initial mailing, a postcard follow-up was sent to all recipients of the survey, which is consistent with the Dillman TDM mail-out survey methodology. The note on the follow-up postcard was crafted in such a way as to serve as a thank-you note to those veterans that had responded to the survey and as a reminder to those who had not. A draft copy of this follow-up postcard is attached as Appendix D.
An initial response rate was determined to be approximately 25%-30% of the pre-test sample. Out of 14,100 surveys that were initially mailed out, 3,621 completed surveys were received back. It is important to note that some 2,127 survey packages were returned unopened, due to either the respondent being deceased, or no longer residing at the address. This is an important finding in and of itself, and merits further investigation, if only for the accuracy of the VA pension and compensation rolls. The revised total number of potential respondents (14,100 minus 2,127 deceased and returned) resulted in a final count of 11,973. The 3,621 completed surveys that were received comprises a response rate of 30.2% (n=11,973), which is well within expected mail out survey response rates.
RESULTS
The quantitative and categorical elements of the responses were analyzed using pertinent descriptive statistics. Where appropriate, multivariate and non-parametric analytical techniques (cross tabulation, phi coefficient, odds ratio) were employed to ascertain relationships between demographic and needs variables. Due to occasional respondent error in completion of some items on the returned surveys, missing cases for individual items appear within the data set. To compensate for this investigators employed the valid percent response method when calculating results from these data. Resultant descriptive data are displayed in Appendix F.
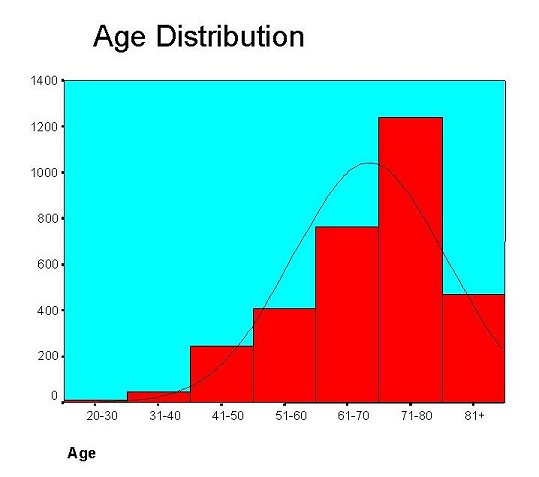
Figure 1. Age distribution of blinded veterans surveyed.
Findings from AREF Williams #0001, "Needs Assessment of the Visually Impaired Veterans".
Although a wide range of respondent profiles emerged from these findings, project investigators felt that a composite profile should be developed in order to facilitate a clearer, more descriptive characterization of the veterans responding to this survey. Findings clearly indicated two descriptors that emerged that set respondents apart, those being age, as well as receipt of some type of VA sponsored services. The typical profile of survey respondents was a recreationally active, 71-80 year old person living with a spouse, family member or roommate. Furthermore, the typical respondent profile showed a veteran that had either never received VA sponsored blind rehabilitation services, or had received these types of services over 5 years ago. Of those veterans that had obtained VA sponsored blind rehabilitation services, inpatient blind rehabilitation was shown to be the most common type of service received. While some respondents indicated complete blindness with no light perception at all, the majority of respondents said they could see some light, but had difficulty making out shapes and forms. Although the most common respondent profile shows some previous contact with a Visual Impairment Services Team (VIST) coordinator, a significant number indicated never receiving VIST contact. Further commonalties in respondent profiles exhibited that the majority of veterans surveyed do not currently use computers, although nearly half of survey respondents indicated an interest in learning to use computers (see Appendix F).
Findings indicate that 77.6% of respondents were 61 years of age or older, with only 9.6% of respondents being aged 50 years old or younger. The distribution of age of respondents is shown in Figure 1. Analysis of living situation of respondents reveal that 94.6% live with a family member, spouse or alone, with only 4% residing in an institutional setting. Findings indicate that across all age groups of visually impaired veterans, living situation tends to include habitation with either a spouse, family member or friend, with an increase in the incidence of living alone becoming more apparent primarily within the older respondents, in particular among those veterans 71 years of age or older. The population residing in an institutional setting is almost exclusively 61 years or older. The distribution of living situation by age of respondents is shown in Figure 2.
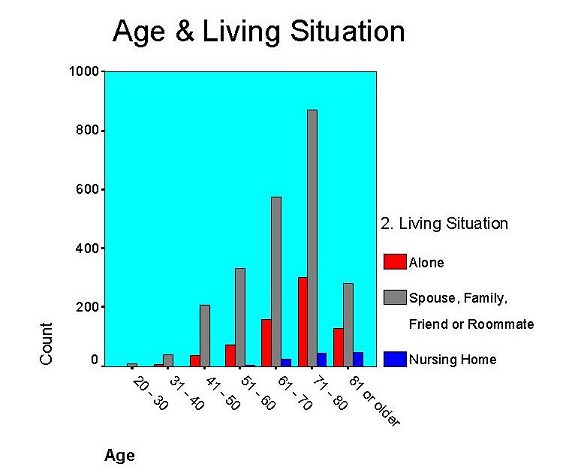
Figure 2. Living Situation and Age of Blinded Veterans Surveyed.
Findings from AREF Williams #0001, "Needs Assessment of
the Visually Impaired Veterans."
A closer appraisal of duration of time since last VA sponsored blind rehabilitation training reveals that 247 respondents, (7.5%), said that they had received some type of training within the past year, while 604, (18.4%), had received blind rehabilitation training within the last 5 years. Another 1,015 respondents, (30.9%), said that they had received VA sponsored blind rehabilitation training over 5 years ago. The largest group of respondents, some 1,421 (43.2%), indicated that they had never received VA sponsored blind rehabilitation training. When age is used as a co-variate of blind rehabilitation services received, younger veterans appear to receive VA rehab services more often than do older veterans. For example, in a cross-tabulation of veterans 20-60 years of age versus veterans 61 years or older, 33.6% of younger veterans report never having received services, as compared to 46.3% of older veterans reporting never having received blind rehab services. The distribution of visually impaired veterans never receiving blind rehabilitation services by geographical location is shown in Figure 3.
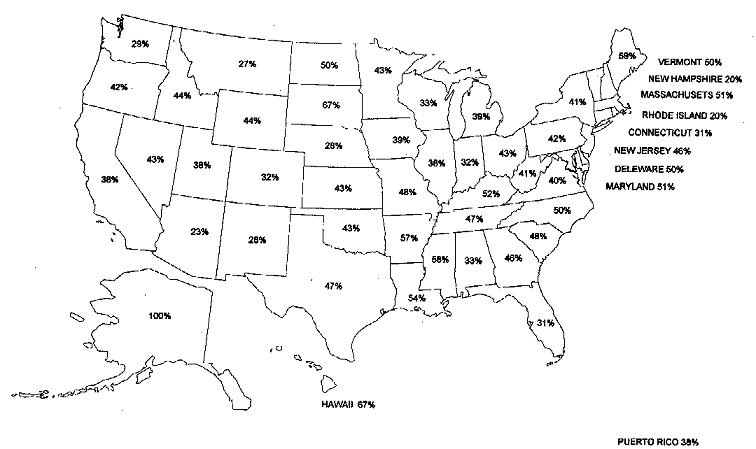
Figure 3. Veterans Not Receiving VA Blind Rehabilitation Services by State
Findings from AREF Williams #0001. "Needs Assessment of the Visually Impaired Veterans"
Survey findings examining current major activities revealed that 4.6% of respondents are currently employed for pay, 3.1% are currently attending school or training, 13.3% volunteer, with 36.4% considering themselves recreationally active. The distribution of current major activities of respondents is shown in Figure 4. These findings are consistent with results gathered from the current VA research project C2179R, "Outcome Assessment of the Rehabilitation of the Visually Impaired", specifically in the areas of employment (5%), volunteer (10%), and recreationally active (47%).
The similarity of current major activities findings between the "AREF Williams
#0001 Needs
Assessment of Visually Impaired Veterans" and "C2179R Outcome
Assessment of the Rehabilitation of the Visually Impaired" indicates that these two
populations are indeed very similar, and most likely share to a large degree the same
demographic, diagnostic and rehabilitation service characteristics.
An evaluation of VA services received indicated that 36.8% of respondents had attended inpatient blind rehabilitation from one of the VA Blind Rehabilitation Centers (VA BRC). Additionally, 20.5% of survey respondents have received VA outpatient blind rehabilitation through the Blind Rehabilitation Outpatient Service (VA BROS) program, and 14.5% respondents have had involvement with the VA’s Visual Impairment Center to Optimize Remaining Sight (VA VICTORS) program. Findings indicate that 15.3% of respondents have received blind rehabilitation services that were not affiliated with the VA.
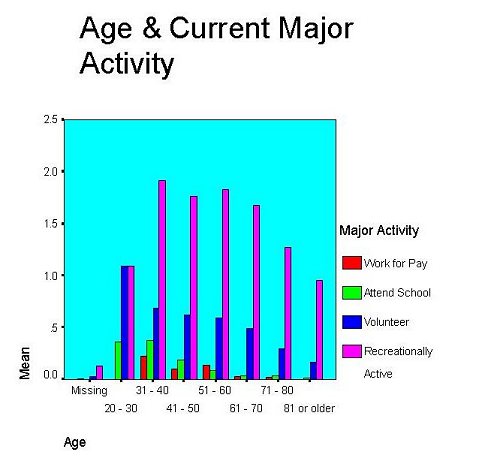
Figure 4. Current Major Activity and Age of blinded veterans
surveyed.
Findings from AREF Williams #0001, "Needs Assessment of
the Visually Impaired Veterans".
An assessment of visual status demonstrates a fairly wide distribution throughout the respondent sample in terms of level of visual disability. Visual status of respondents for each item was investigated without the use of magnification or low vision devices, and was indicated as such on the survey instrument. Analysis of the data showed that 18.4% of all respondents had no light perception. Findings show that 44.7% of respondents felt that they could make out shapes and forms. Visual status findings also revealed that 38.9% of survey respondents said they were able to see television sitting very close. Additionally, 31.3% reported being able to see very large printed letters, such as the kind that one would expect to see on an eye chart. 21.5% reported being able to see newspaper headlines, while 5.7% of respondents reported they could see small print. Furthermore, these data indicate that of this population, 80.1% report having experienced some loss of side vision.
An exploration of previous contact with a Visual Impairment Services Team (VIST) coordinator revealed that 1,358 (43.9%) of respondents reported never having contact with his or her VIST coordinator. Of the 1,740 veterans who indicated having had contact with their VIST coordinator, 925 (79%) reported receiving VA inpatient blind rehabilitation training. Further examination revealed that of veterans which had indicated prior contact with a VIST coordinator, 63.5% were younger veterans (under 61 years of age) versus 54% of older veterans (61 years or older).
Findings revealed that 39.7% of respondents felt that they needed or required vision services at this time. Even when age of respondent was introduced as a co-variate, results indicated only small between group differences in perceived need of vision services at this time. For example, 38.5% of veterans age 81 or older felt they needed or required vision services. Similarly, 39.1% of veterans aged 71-80, 40.7% of veterans aged 61-70, 39.3% of veterans aged 51-60, and 41.3% of veterans aged 41-50 indicated current need of vision services.
Additional findings examining the current level of computer use by this population found that 15.5% of respondents were using computers at this time. After further analysis, a difference between younger and older veterans regarding current utilization of computers emerged. Findings indicated that 39.4 % of veterans under 61 years of age reported using computers currently, as compared with only 8.4% of veterans 61 years or older. Moreover, these findings revealed that 49.2% of respondents expressed an interest in using or learning computers and computer technology.
After careful examination of findings from these data, it is apparent that age plays a significant role, particularly on dependant variables such as current major activities, receipt of VA sponsored inpatient and outpatient blind rehabilitation services, and computer use and interest in learning or using computers. For example, using an odds ratio (OR), it can be shown that persons younger than 61 years of age (OR=.136, phi coefficient = .225, p<.001) are over seven times more likely to be currently working for pay than are than are persons over 61 years of age. This finding is consistent with expected levels of employment and age, and bears out previous discussion of older, visually impaired veterans and level of employment above. Similarly, persons older than 61 years of age (OR=.141, phi coefficient = -.360, p<.001) are over seven times less likely to be currently using computers than are than are persons under 61 years of age. Of particular interest in considering these two variables, (work for pay, current user of computers), is the impact that current use of computer technology has for potential employment within this population.
CONTENT ANALYSIS
In an effort to develop a more comprehensive profile of the veterans responding to this survey, a section was provided for respondents to direct whatever comments they wanted to make. Some 626 sets of comments were attached among the 3,621 surveys received. These comments were transcribed into a computer word processing program, and then analyzed for trends, similarities, differences, and other patterns. One of the important uses of content analysis is the generation of indicators that can help determine how the concerns of a single society, institution, group, or other social organization differ (Weber, 1985). Although the primary methods of content analysis are qualitative rather than quantitative, the aim of this portion of the research project was to utilize multivariate data analysis techniques such as cluster analysis to assist investigators in identifying common themes in the text.
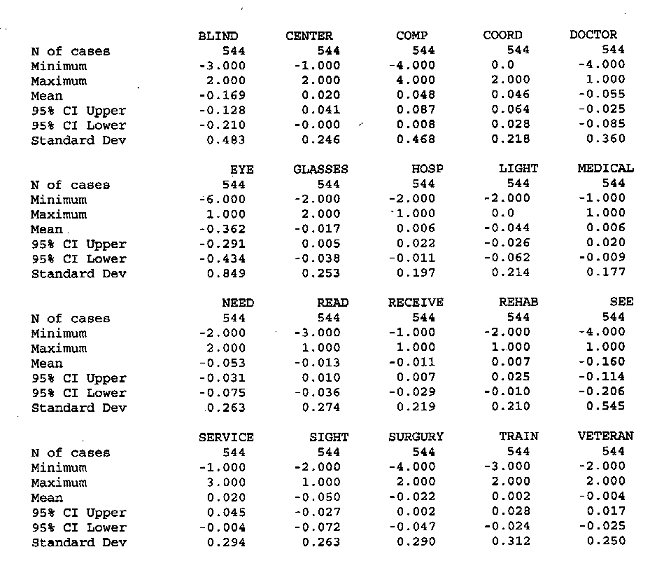
Some 22,323 word units were identified from the transcribed text stemming from 626 separate comments provided by the respondents. A frequency of occurrence procedure was then performed on the text in order to ascertain words that had the highest level of frequency. Investigators established a word frequency cutoff point of .1%, which eliminated words that appeared less than 12 times throughout the combined text file. Investigators identified 43 words that had some relationship with visual impairment, blindness, rehabilitation, needs, services etc. These words were then individually examined, in context with the entire comment that they appeared, in order to determine the tone and thematic content for each occurrence. Each word was then scored using a three-point scale: -1 indicated a negative connotation; +1 indicated a positive connotation; and 0 indicated a neutral or off-target connotation. Thus an aggregate score was calculated by summing the negative and positive occurrences for each word. An example of a negative connotation would be: "Dear Mr. Williams: I am very disappointed in the VA hospital blind rehab center". In this case the words hospital, blind, rehab, and center were each assigned a negative score. An example of a positive connotation would be: "I have attended the Blind Center and received excellent training and exams for Tunnel Vision, dry eyes and mobility!!!" In this case Blind, Center, received, training, vision and eyes were all assigned a positive score. This method of word scoring facilitated grouping the various words into larger component groups, as well as identifying commonalties among and between similar words such as doctor and doctors, vist and coordinator, and so on. This resulted in 22 primary word groups. Descriptive statistics were computed for each of these groups.
Tables are in graphical format
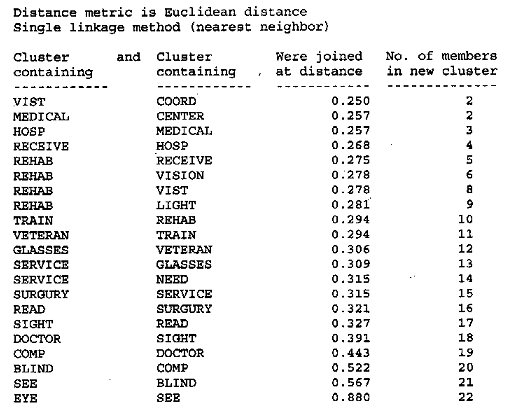
From this analysis it can be seen that the most proximal word groups consist of vist and coord. This cluster quickly groups with medical, hospital, and center followed by rehab, vision, light, veteran, training, glasses, service, need, surgery, read, sight, doctor, computers, blind, see, and eye. The most proximal word groups represent terms that commonly occurred together (such as "vist coordinator"). The most distal word groups represent words that carried homonymous or antonymous meanings that minimize the probability of their simultaneous use in a single response (such as eye, see, and blind). The middle distance groupings (such as training and glasses or sight and reading) ultimately provided the most useful information for discussion.
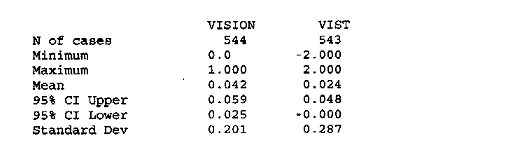
Further examination of mean scores of individual word groups indicates that those words associated within a visual domain scored consistently negative as compared with other word groups. For example, Blind scored a mean of -.169, Eye scored -.362, Glasses scored -.017, Read scored -.013, See scored -.16, and Sight scored -.05. Other words that scored negatively were Doctor, which scored a mean of -.05, Surgery scored -.022, Need scored -.053 and Receive, which scored a mean of -.011. The words groups that were scored positively were associated within a service/program domain. These word groups consisted of Center, which scored .20, Computer scored .048, Coordinator scored .046, Hospital scored .006, Medical scored .006, Rehabilitation scored .007, Service scored .02, Train scored .002, and VIST, which scored .024. These findings indicate that two thematic domains appear from the text, a visual domain, and a service/program domain. The only word that was associated within the visual domain with a positive score was the word Vision, which scored a mean of .042. Investigators believe that the positive association with the word Vision stems from the fact that it is often used in connection with other positively associated service/program domain words. Based on these word group associations, as well as the mean score of each component with each domain, an overall assessment of content can be inferred. It would seem that the visual domain does have a consistent negative connotation, while the service/program domain appears to have a positive connotation. These findings are consistent with results gathered from the current VA research project C2179R, "Outcome Assessment of the Rehabilitation of the Visually Impaired", specifically in the areas of dissatisfaction with visual abilities, as well as levels of satisfaction with services and training received. Although these findings do show interesting trends and tendencies among the various word groups, further content analysis on this population is suggested.
DISCUSSION
When evaluating the utilization of VA sponsored blind rehabilitation services by veterans, age appears to play a significant role. Likewise, other factors other than simply age may play a role in these findings, such as higher incidence co-morbid involvement in the older population that could negatively impact blind rehabilitation. Perhaps other, less obvious factors such as the help-seeking behaviors demonstrated by younger versus older groups within this visually impaired population may play a role in the utilization of VA sponsored blind rehabilitation services. One possible explanation for the modest level of VA-sponsored blind rehabilitation service delivery to this visually impaired veteran population may lie in the lack of familiarity with the actual title of the blind rehabilitation services received by the respondents. For instance, perhaps some veterans have indeed received Blind Rehabilitation Outpatient Service (VA BROS) training, but they don’t recognize the official name of this service. Thus, conclusions regarding level of VA blind rehabilitation service delivery based on this data should be tempered with this in mind. Regardless of these speculations, however, the results from these data clearly demonstrate that 1,421 (43.2%) of respondents indicated that they had never received VA sponsored blind rehabilitation training. With the anticipated growth in the overall size of the visually impaired veteran population in the coming years, coupled with the finding from these data, further research examining service delivery and utilization of VA sponsored blind rehabilitation is warranted.
With the increasing growth and influence of computer technology in all levels of modern society, particularly in the workplace, computer literacy and familiarity with this technology in general is becoming a crucial and basic skill. Furthermore, the growing reliance on electronic communication such as email and document facsimile, as well as access to a vast network of information via the World Wide Web further strengthens the need for persons with disabilities to avail themselves of this new technology. With the growing availability of computer technology specifically designed to accommodate persons with disabilities, such as speak back text programs, high contrast and high magnification displays, optical recognition and scanning devices, as well as speech recognition programs, visually impaired persons have increased opportunities for training and potential employment. Although the majority of survey respondents (2,741) indicated they are not currently using computers, a significant number (943) expressed an interest in using or learning to use computer technology. Investigators believe that a significant number of missing responses for the question "Do you have an interest in using or learning computers" may indicate a lack of interest, as demonstrated by declining to answer the question entirely by 1,421 respondents. These findings support the need for more detailed, in-depth analysis of the potential impact that computer technology can have for this particular visually impaired population.
Findings from this survey reveal a wide distribution of respondent characteristics and profiles making up this sample of visually impaired veterans. Unfortunately, due to the limitations of the survey instrument these data are somewhat general and broad. This was unavoidable due to the expressed desire and intentions of the project funding agency, Blinded American Veterans Foundation (BAVF), which felt that a brief, one-page, large print survey was the format investigators should follow when designing the survey instrument. Certainly this survey format limited the size and scope of the research findings. What has been determined from these findings, however, is that significant variations and variability appear along and throughout the entire sample of visually impaired veterans examined. It is therefore crucial that further, more in-depth research looking at salient issues impacting this population, such as differences in receipt of services, as well as other programmatic, diagnostic and psychometric areas be pursued in the near future. Although findings from this research will help to develop a clearer picture of this visually impaired veteran population, further research needs to continue in this area in order to enhance provision of clinical and rehabilitation services for this group.
BIBLIOGRAPHY
Dillman, Don A. (1978). Mail and Telephone Surveys: The Total Design Method. New York, New York. Wiley-Interscience Publications.
Garner, Don (1995). Personal communication with William De l’Aune.
Goodrich, Gregory L. (1995). Growth in a Shrinking Population: Visual Impairment in the Veteran
Population 1995-2010, Palo Alto: VA Palo Alto Health Care System.
Kizer, Kenneth, W. (1996). Prescription for Change. Department of Veterans Affairs internal document.
Weber, Robert P. (1985). "Basic Content Analysis." Sage University Paper Series on Quantitive
Applications in the Social Sciences 07-049. Beverly Hills and London: Sage Publications.
BAVF Home |
Who We Are | Sgt. Shaft | Flag Week | Links | Financials |
Search | Contact BAVF
BAVF - P.O. Box 65900,
Washington, D.C. 20035-5900
 This website is another fine
Product of Tinybeetle Enterprises.
For website design and creation,
write to: tinybeetle@gmail.com
Copyright BAVF 2000